Rugby World Cup 2019 - Statistical Analysis
Rugby World Cup 2019 - Statistical Analysis
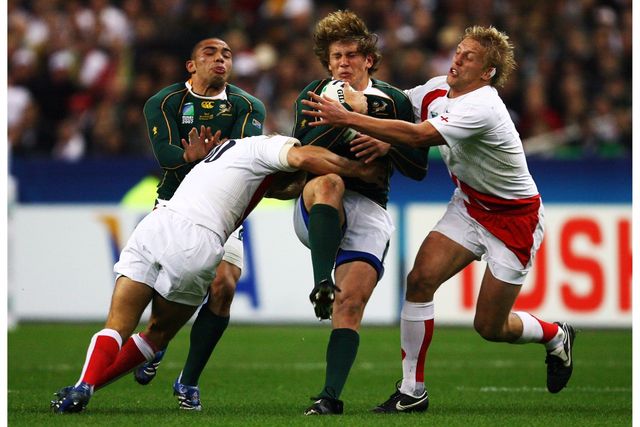
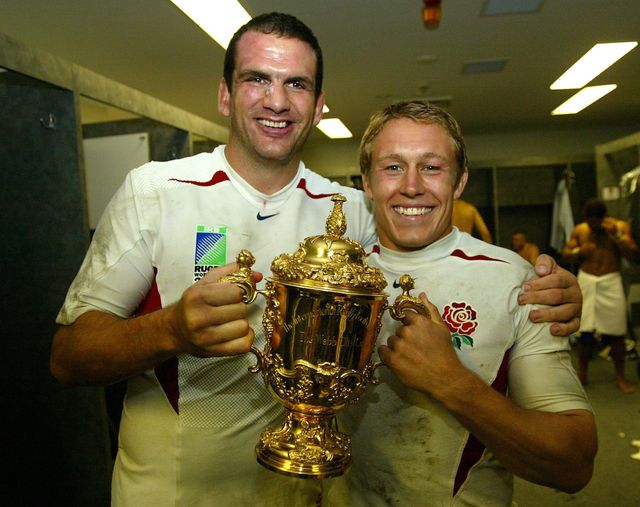
South Africa continued their 12-year cycle of victories, having lifted the Webb Ellis Cup in 1995, 2007 and 2019. In Japan, they became the only team in RWC history to lose a game on the way to being crowned champions.
Throughout the tournament, they maintained and delivered the strategic approach that defines South Africa rugby.Their game is based around territory, powerful set pieces, aggressive defence and a formidable replacement bench. Possession is not a priority. Its core objective is to produce continuous pressure. Some data from their matches illustrate this:
- They obtained less possession than 18 of the other teams in the pool stage, and less than both their opponents in the semi-final and final.
- Their lineout success rate was 99% – only one lineout was stolen – and they won 10 lineout steals
- They won the most penalties on their own scrum and won the most turnovers and penalties on their opponents’ scrums
- They scored almost half their tries from within their opponents’ 22-metre line
- They kicked the most penalty goals
- They conceded only one try at the knockout stage
- And they maintained territorial pressure by tapping only one penalty
The Shape of the Game
The overall shape of the game has seen major changes since the sport went professional in 1995. These major changes were referred to in the RWC 2015 Statistical Report. The data showed that the comparative statistics between RWC 2015 and RWC 2019 were very similar, except for a reduced number of penalties.
The similarities in the above table should not suggest, however, that there is close conformity in the way teams play the game. One of the defining features of rugby is that there is not just one way to win a game. Its format and shape are often dictated by a variety of factors – from the skill sets of available players, their physicality, the conditions under which the game is played right through to a national culture.
The Hosts - Japan
It did not take long for RWC 2019 to come to life.
It started on day two with Fiji, who exhibited their special range of skills and power in causing Australia major problems for most of their game. That game was followed by an outstanding game of rugby between defending champions New Zealand and South Africa, which was then closely followed one of Rugby World Cup’s biggest upsets when Uruguay beat Fiji.
Then Japan made their second appearance and the dynamic of the tournament accelerated. Not only did Japan – a tier two team – beat tier one team Ireland but they produced a brand of rugby that excited all of rugby’s stakeholders. And then they did it again, beating Scotland on the way to a first ever quarter-final, making it the first time in RWC history that a tier two team had beaten two tier one teams in the pool stage.
But there was something even more to this than Japan’s two victories. They brought to their games a view of rugby and a strategic approach that was different from any other team. Japan produced another vision of the game which excited all observers.
They looked, for example, at the two set pieces of rugby – the scrum and the lineout – in a quite different light. The scrum was not seen as a vehicle for producing penalties but as vehicle for providing rapid possession. They also saw the lineout not as a vehicle for producing mauls, but as method of producing rapid distributable possession.
An examination of the data illustrates this:
- When Japan won scrum ball, the ball appeared in around five seconds – three and four seconds was not uncommon. Scotland’s ball, however, came out in seven seconds, the Irish ball came out after 11 seconds and in the earlier pool match between New Zealand and South Africa the ball took nine seconds to move away from the scrum.
- At the lineout, Japan mauled the ball on only six occasions but distributed it on 31, giving them a distribution rate of 86 per cent. No other tier one team came near this as can be seen in the table.
The set pieces made it clear that Japan’s emphasis was on quick distributable ball – and to maximise the benefits of such possession they needed to determine a specific approach to open play.
They did – and it was based on speed. This required, and resulted, in an accelerated rate of passing and rucking, a minimising of kicks and a highly developed skill set.
Their success in achieving this was clearly shown in their two tier one wins and the pace of their game was not matched in any of the five tier one v tier one matches that were played in the pool stage.
In open play, Japan continued to maintain a high speed of play with a pass every 6 seconds of possession with a noticeable number of passing movements containing more than three passes. Not surprisingly the Japan centres were the most likely centres to pass, making one pass in every 1.7 possessions.
Then, in the knockout stages, Japan’s progress ended when they faced a team whose approach to the game was completely different. South Africa’s game was, as expected, being based around territory, powerful set pieces, aggressive defence and a formidable replacement bench. Its core objective is to produce continuous pressure.
Some examples from their match against Japan illustrate this
- After half-time, the first time that any Japanese player touched the ball inside the South Africa half of the field was in the 67th minute
- South Africa had 80% more possession than Japan in the second half
- They made over twice as many rucks and 60% more kicks in the second half
- Six South African forwards were replaced during the last 45 minutes of play
This approach was not only successful in beating Japan but saw South Africa win RWC 2019.
The Competition
RWC 2019 confirmed, once again, that in most games, it is tries that win matches. In Japan – just as at RWC 2011 and RWC 2015 – the winning team scored the most tries in some 80 per cent of matches. The team scoring the fewest tries has won on only eight occasions in the last 141 RWC matches.
Further, and including RWC 2019, no final has been won by a team scoring the fewest number of tries even though in the six Rugby World Cup finals preceding RWC 2015, and the 2019 final, penalty goals outnumbered tries by a factor of five to one.
RWC 2019 also confirmed another misconception which is the points value of a yellow card. It is frequently claimed that a yellow card is worth seven points. This has never been the case. At RWC 2019, on 50 per cent of occasions there was no points benefit whatsoever to the team with 15 players and if an average points benefit figure is to be used, it was two points.
One of the defining features of rugby is that there is not just one way to win a game and this was seen at RWC 2015 where several different playing approaches were on display.
A comparison of two matches illustrates this – Japan against Scotland where the approach of both teams was based on a fluid expansive style of rugby, and South Africa against Wales where defence and physical pressure were the dominant factors. While ball-in-play was the same in both matches, there were several major differences:
- There were 358 passes in the Japan v Scotland game – more than twice as many as the 172 in the South Africa v Wales game
- The rate of a pass every 6 seconds in the Japan v Scotland game was twice that of the 13 seconds seen in the South Africa v Wales match
- There were two and a half times more kicks in the South Africa v Wales match, where there was a kick every 22 seconds compared to every 75 seconds in the Japan v Scotland match.
- Scrum-halves in the Japan v Scotland match had a pass to kick ratio of 42:1 in contrast to the South Africa v Wales game where it was 3:1
- Overall, the Japan and Scotland half-backs passed the ball 270 times and kicked 24 times – a ratio of 11:1. The half-backs in the South Africa v Wales game passed the ball 131 times and kicked it 59 times - a ratio of 2:1
- There were more rucks in the Japan v Scotland game and the ruck rate was 30 per cent faster
The playing styles and outcomes in the other RWC matches hovered between these two extremes.
Performance of Tier 2 teams
In all Rugby World Cups there are some close matches between tier one and tier two teams – and RWC 2019 was no exception. In addition – and for the first time - a tier two team (Japan) beat two tier one teams.
Overall, however, and despite RWC 2015 suggesting that there may have been a potential narrowing difference in performance between tier two and tier one teams, the performance gap between tier one and tier two teams shows little if no change.
This is shown in the following tables which look at closeness of the results in matches between tier one and tier two teams. The tables are divided into two – matches where the winning margin was 10 points or fewer and those where the winning margin exceeded 30 points. In both categories’ changes have been minimal.
- Margins fewer than 10 points
In all the RWC matches won by the tier one teams since 1987, 13% have had a winning margin of fewer than 10 points. At RWC 2019, it was also 13%. This percentage has run through almost all nine tournaments, the only exceptions being 23% in 1991 and 9% in 2015 as shown below.
2. Margins more than 30 points
In all the RWC matches won by tier one teams since 2003, 55% had a winning margin of 30+ points. At RWC 2019, it was 54%.
There has, however, been a reduction in the highest scores achieved by the tier one teams over the last 25 years, albeit the three highest scores in Japan were very similar to RWC 2015.
A further measure of the challenge facing tier two countries is shown in the table below. It shows that at RWC 2019 tier one teams score seven times as many tries as their tier two opponents in the first half and almost four times as many in the second half.
While the previous tables show no narrowing of the gap between tier one and tier two teams, matches several matches produced promising and exciting performances by tier two teams.
- JAPAN’s wins against Ireland and Scotland made them the first team to beat two tier one teams in any RWC
- FIJI produced some outstanding rugby in their pool match against Australia and were in the lead until the 58th minute of the game. They also produced an exciting performance against Wales, who only moved into the lead in the last quarter of the game
- URUGUAY produced the most important win in their history and one of the most memorable in RWC history when they beat Fiji. They also impressed against Wales and were within eight points until the last 12 minutes of the game
- TONGA, despite winning just one match, improved as the tournament went on and ran France extremely close losing by 23-21
However, there were some teams and matches which highlighted the challenges facing for tier two teams.
- GEORGIA came into the tournament with an impressive record against other tier two teams. They won the Rugby Europe Championship again in 2019 which gave them a five-year record containing 24 wins in 25 matches – and they came into RWC 2019 hoping to challenge their record of having lost all 10 of the matches they had played against tier one countries in previous tournaments. However, they lost both matches against tier one opponents by points margins of 29 and 19.
The data suggests that the while the forward-based approach adopted by Georgia produces success against tier two teams, it is not being replicated against tier one teams. At RWC 2019, for example, while Georgia won the most scrum penalties on their own put in, they also conceded the most on their opponents’ , put-in where they won one penalty but conceded five.
- SAMOA did not match some of the successes they achieved in previous Rugby World Cups, winning one game out of four – against Russia.
- RUSSIA scored one try in the fourth minute of their first game – and then they failed to score another try in the remaining five hours 17 minutes that they played
- NAMIBIA conceded a try every 1m 59s – the most of any team.
The Players
The players at RWC 2019 were born in a wide range of countries, played in numerous countries and were of different shapes and sizes. This is illustrated in the three following sections.
Where players were born
Immigration, emigration and the possibility of adopting a new nationality is now exercised far more frequently as a result of professionalism. The result is that an increasing number of the players were not born in the country that they now represent. At RWC 2019, for example, 81 players were born in New Zealand, 53 of whom played for other countries, 43 players were born in South Africa with 16 representing other countries, and 42 were born in England with 16 representing other countries
Of the 20 participating countries in Japan, in only two countries were all 31 players born in the country they represented (Argentina and Namibia). In two others they were in a minority (Samoa and Tonga). All countries are shown in the table below.
Where players played their rugby
Just over two thirds of the players played in their home country.
There were five teams where every squad member played his rugby in the country he represented – New Zealand, Ireland, France, England and Japan. This is shown in the table below.
The following table shows the countries where the 225 foreign based players play rugby – 60% played in England and France.
Players' weight
The average weight per player was 103kg or 16st 3lbs. The average weight of the players of each team is shown below together with the heaviest and lightest.
Game issues
There were a number of talking points following RWC 2019, including the time taken at scrum, driving lineouts from five metres and the usage of substitutions. These topics are addressed below.
Scrums
The question is often asked – how long do scrums take? i.e. how much time is taken between the referee awarding a scrum and the subsequent completion of the scrum. This was looked at for RWC 2019.
The answer, however, is not as easy as the question.
This is because in almost all matches there is often a stoppage in play between the time the referee blows the whistle for a scrum and the end of the scrum. It is often due to an injury or a replacement. During this stoppage time, the players will move towards the place where the scrum is to take place and start their preparations while the clock has stopped. The result is that certain scrums can take as little as 30 seconds.
In order therefore to obtain a more accurate figure of how long the average scrum takes, scrums containing a stoppage need to be isolated from those scrums that do not contain a stoppage.
This exercise was done at RWC 2019.
RWC 2019
During the tournament, there were some 600 scrums. The time taken between the referee blowing his whistle for each scrum and the time the ball emerged from the scrum was noted. All scrums were included, including those containing a stoppage and a reset. The result produced an average scrum time of 69 seconds.
Another exercise was then undertaken which excluded scrums that contained a stoppage. The average scrum time then went up to 79 seconds.
When the above overall average was broken down further between pool matches and knockout matches, a further small variation appeared. Pool matches averaged 79 seconds while knockout matches averaged 82 seconds.
The analysis shows that in RWC 2019, the average scrum took around 80 seconds.
The data also showed that there were 83 scrums that took 100 seconds or more, of which 12 each took over 150 seconds or two and a half minutes. One scrum exceeded three minutes.
Scrums, therefore, can take up a significant amount of ball in play time.
In the eight knockout matches in RWC 2019 the scrum took up an average of 18% of ball in play time. The highest percentage was 26% where the scrums took over 20 minutes – the lowest was 9%.
Despite this absorption of time, there are periods in many games where 20 or more minutes will not see a single scrum. This happened for example in several games at RWC 2019, including New Zealand v South Africa, Wales v South Africa and Australia v Fiji. In Ireland’s two matches against Scotland and Japan the first scrums were in the 18th minute.
Lineouts
The lineout has always been a significant element in the game with RWC 2019 showing that 49% of all tries came from lineout possession. It was by far the most fruitful source of possession as shown in the following table.
- The rate of sanction was one penalty/free kick per 55 lineouts or an average of less than one per game.
- There was not one penalty goal kicked because of a lineout offence.
- The team throwing the ball in conceded one penalty in the entire tournament while the opposing team conceded 14 penalties – eight for barging and six for tackling in the air. They also conceded five free-kicks – four for closing the gap and one for numbers.
Origin of lineout tries
Of the 138 lineout tries, 53 or almost 40% came from lineouts within nine metres of the goal-line. Of the 53, 39 were on the five-metre line, 14 were between six and nine metres. The locations of the lineouts that produced all 138 tries are shown in the following table
The 53 10-metre tries shown above came from 174 lineouts giving a success ratio of one try every three lineouts, Of the 53, 27 were immediately driven over for a try. The remaining tries included a varied selection of passes, rucks and kicks.
The success ratios from other parts of the pitch are shown in the following table.
Overall, there was a conversion rate of one try from every eight lineouts.
Substitutions
In the modern game, almost all 23 players in the match-day squad are used and this was illustrated in the 13 tier one matches played at RWC 2019
- There were more than 200 substitutions, producing an average of 15.6 per game.
- 97% of available substitutes were used
- All eight substitutes were used on 81% of occasions – seven and eight in 96%
- 94% of substitutions were made in the second half
- Almost 60% of substitutions were made in the last 25 minutes of the game
- The entire front row of both teams was replaced in 11 of the 13 matches.
With regard to the rate of substitution of each of the 15 individual players:
- Tight-head prop (No.3) was replaced in every game (100%)
- Loose-head prop (No.1) and Scrumhalf (No.9) were the next highest on 91% of occasions and
- Outside-centre (No.13) was replaced twice as often as Inside-centre (No.12)
The table below shows the rate for all 15 positions.
Front-row substitutions at RWC 2019
- The average number of scrums participated in by a front-row player was five.
- A third of all front-row players participated in four scrums or fewer
- Only three per cent participated in more than 10 (i.e. five out of 148)
Did you know?...
- In only two teams were all 31 players born in the country they represented (Argentina and Namibia). In two others they were in a minority (Samoa and Tonga)
- Eighty-one players at RWC 2019, were born in New Zealand, 43 were born in South Africa and 42 in England
- There were only five teams where every squad member played his rugby in the country he represented – New Zealand, Ireland, France, England and Japan
- Just over two thirds of the players played in their home country
- Of the 93 players that represented Fiji, Samoa and Tonga, 87 played their rugby overseas
- When tier one teams played tier two teams, they scored seven times more tries in the first half and between three and four times as many in the second half
- The winning team scored the most tries in some 80 per cent of matches. The team scoring the fewest tries has won on only eight occasions in the last 141 RWC matches
- At RWC 2019, in 50% of yellow cards, there was no points benefit whatsoever to the team with 15 players. The overall average points benefit was just two
- The average weight per player was 103kg or 16st 3lbs. Tonga were the heaviest team
- The average scrum took around 80 seconds. Scrums took just under 20% of playing time
- Almost 50% of tries came from lineout possession
- The team throwing the ball into the lineout conceded one penalty in the entire tournament
- There was one penalty/free-kick per 55 lineouts, one penalty/free-kick per 27 breakdowns and one penalty/free-kick per four scrums
- Of the 138 lineouts, almost 40% came from lineouts within nine metres of the goal-line
- 97% of available substitutes were used
- Tight-head prop (No.3) was replaced in every tier one v tier one game (100%), loose-head prop (no1) and scrumhalf (No.9) were the next highest on 91%
- The average number of scrums participated in by a front-row player was five. A third of all front-row players participated in four scrums or fewer. Only three per cent participated in more than 10 (i.e. five out of 148)
- A successful drop goal was kicked once every eight matches


